Top 10 US Imports from China to Take Advantage of Devalued Yuan (w/ pics)
Right now is a great time to import products from China.
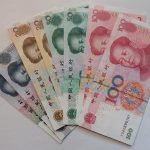
China’s devaluation of its renminbi, commonly referred to as the yuan, has been all over the news lately. In fact, it was the first story we featured in the last blog, 3 China News Stories Shippers Should Know About.
What does this mean for the U.S., and specifically shippers?
It means the cost of Chinese products is down, a factor that can majorly increase the bottom line for companies that import goods from China.
The short of it is, you can make more money importing from China right now.
If you’ve been wanting to get into the importing game, now is a great time. For those new to shipping goods from China to sell in the U.S., the question often is: What should I import?
If there is a super basic rule for picking a product to import from China, it is import what you can sell.
Usually, I recommend picking a product you are passionate about, you can import in bulk, and that you have a strong base knowledge about.
Of course, researching the top imports from China is never a bad idea either.
Back in 2012, I wrote a blog counting down the top 10 imports from China. That blog turned out to be one of Universal Cargo’s most popular pages of all time. It’s about time we update the list.
Since full numbers have not been made available from 2015 yet, this updated list shows the top 10 import goods from 2014. You’ll notice many of the product categories from 2011’s top imports from China list (that we posted back in 2012) are still on the list years later. However, where the import products rank has changed.
The source for this list is World’s Richest Countries.
2014 saw $397.2 billion worth of China’s exports shipped to the U.S. Here they are counted down, David Letterman style, from 10 to 1. A bonus in this list is the billions of dollars worth products were imported from China in each category.
10. Medical, technical equipment
$9.4 billion

9. Vehicles
$12.3 billion

8. Plastics
$12.8 billion

7. Toys, games
$13.2 billion

6. Footwear
$13.9 billion

5. Clothing (not knit or crochet)
$14.3 billion

4. Knit or crochet clothing
$16.2 billion

3. Furniture, lighting, signs
$24.2 billion

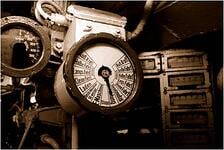
2. Machines, engines, pumps
$90.9 billion

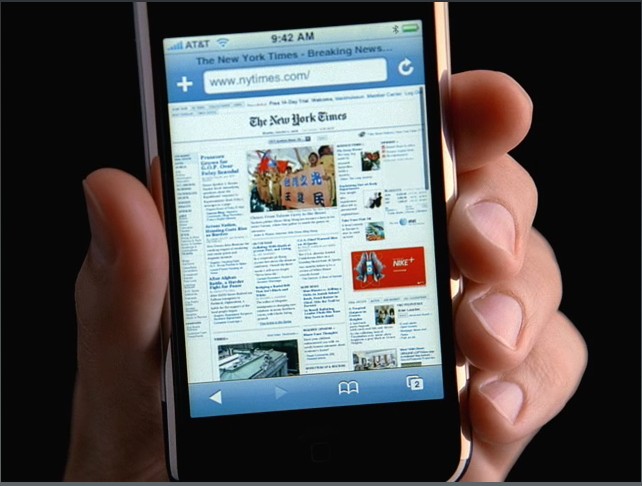
1. Electronic equipment

![]()
Source: UC Blog


