Made in China: U.S. Import and Spending
Working on blogs like this one, I often squeeze a little, smiley-faced stress reliever I call Red. On the bottom of Red are the words, “MADE IN CHINA.” You’ve seen
 these words on merchandise.
There has been much talk and worrying during the last few years about how China-made-products have infiltrated American stores.
The perception of many is that the majority of American spending is going to China, making that country richer and richer while leaving the U.S. poorer and poorer.
The United States does have a record trade deficit with China and the U.S. has been experiencing recession while China seems to be growing as an economic world power. The assumption that a majority of U.S. spending is going to China seems reasonable. However, research from the Federal Reserve Bank of San Francisco (FRBSF) paints a very different picture.
Those who say all the action is in China should pay attention.
More and more it is recognized that we live in a global economy. People are trading and selling all around the world, not merely in local markets. It is because we live in this world of international trade that freight forwarding companies like Universal Cargo exist, helping you import and export to countries like China all over the world.
Despite growing globalization and the United State’s international presence, FRBSF reports that the U.S. has a relatively closed economy. “The vast majority of goods and services sold in the United States is [sic] produced here,” says FRBSF. 88.5% of U.S. consumer spending is on U.S. made items. Of the 11.5% of spending on imported, foreign made products, 36% of the money goes to U.S. workers and companies.
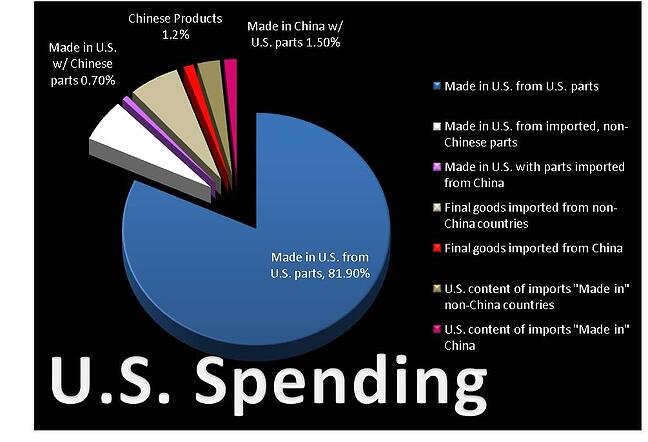
Here’s the breakdown of the personal consumption expenditures (PCE) in the U.S. reported by the FRBSF. In other words, this is where American spending is going:
81.9% – Made in U.S. from U.S. parts
5.9% – Made in U.S. from imported parts from countries other than China
0.7% – Made in U.S. from parts imported from China
6.1% – Final goods imported from countries other than China
1.2% – Final goods imported from China
2.7% – U.S. content of imports “Made in” countries other than China
1.5% – U.S. content of imports “Made in” China

Chinese exports to the U.S. have about doubled over the last decade. However, the total of U.S. imported products from all over the world, including China, has been pretty constant. This means that the increase of Chinese products on American shelves comes largely at the expense of other countries’ products, not American made items.
Don’t give into the hype that China has taken over American spending. American produced products from American workers in American companies are still going strong in this country. All the action is not in China.
Even with all the growth that China’s economy has experienced, the United States still has the world’s largest economy. Now, China’s expanding economy is showing signs of slowing down.
The New York Times reports that China’s economy during the 2nd quarter increased at an annual rate of 9.5%. This is a strong number, but less growth than their economy saw during previous quarters. China is tightening up on lending and experiencing high inflation. It doesn’t seem China can maintain the kind of economic growth they’ve been experiencing and keep inflation under control.
The U.S. struggles with inflation problems of its own. Many fear inflation in China will increase American inflation. Perhaps many of these have an overblown idea of Chinese products in the U.S.
Because of how small the actual percentage of American spending is that goes to Chinese products, FRBSF says that Chinese inflation will not cause broad inflationary pressure on the United States.
Do you agree with FRBSF? Comment below on how you think Chinese inflation might affect the U.S. economy.
![]()
Source: Economy
